Part D: Observability
Part D: Observability
Observability means you can answer questions about the running system from what it records, including questions you did not think of in advance: why was this ticket slow, what did Tuesday's incident cost, did last week's model update change the replies. For an LLM system that takes three kinds of record, and this part builds each:
- Logs and traces: what happened on each request, step by step, with the content made safe to keep.
- Metrics: numbers aggregated over time (latency percentiles, error rate, cost per task), which is what a dashboard shows and alerts fire on.
- Distribution checks: whether the inputs or outputs as a whole are shifting, which no single request reveals.
Logging prompts, responses, and metadata safely
Prompts and replies are the most useful thing to log (you cannot debug a bad draft without seeing it) and the most dangerous (tickets contain emails, phone numbers, card numbers, and whatever else customers paste). Module 11 set the policy; here is the implementation, at the one place every call passes through.
| Field | Log it? | How |
|---|---|---|
| Timestamps, route, provider, model, token counts, cost, latency, attempts, cache status | Always | Plain metadata; this is what dashboards are built from |
| User and customer ids | Yes, as a keyed hash | Stable for joining records, meaningless without the key |
| Prompt and reply text | A redacted excerpt by default; full text only in a restricted store with short retention | Redact before writing, never after |
| Secrets (API keys, tokens, passwords) | Never | Filter them at the gateway, and alert if one appears |
Two techniques do the work. Redaction replaces sensitive patterns with a label before anything is written. Keyed hashing (HMAC) turns a user id into a stable code using a secret key: the same user always maps to the same code, so you can count requests per user, but nobody without the key can reverse it or rebuild the mapping by hashing a list of known ids, which a plain SHA-256 of the id would allow.
The logging, the tracer, and the dashboard all live in one file, because each builds on the previous one:
examples/m13_observability.py
"""Observability for the support assistant: safe logs, traces, and a dashboard computed from them.

Two weeks of traffic are simulated through the Module 13 gateway with fake
providers (ScriptedLLM underneath, so replies are not model output). Latency
and failures are drawn from seeded distributions; on days 9 and 10 the primary
provider rate-limits hard, the way a real incident would look. Everything
below the simulation (redaction, tracing, the dashboard math) is real code you
can point at real logs.
"""
from __future__ import annotations

import contextvars
import hashlib
import hmac
import json
import os
import random
import re
import statistics
from collections import defaultdict
from contextlib import contextmanager
from dataclasses import dataclass, field
from datetime import datetime, timezone
from pathlib import Path
from typing import Any, Callable

from m13_gateway import FakeClock, FakeProvider, Gateway, Quota, Route, ticket_messages
from supportdesk.data import load_tickets
from supportdesk.kb_search import KBSearch

OUT = Path(__file__).resolve().parent / "out"
START = datetime(2026, 9, 1, tzinfo=timezone.utc).timestamp()

# Safe logging ----------------------------------------------------------------------

REDACTIONS = [
    (re.compile(r"[A-Za-z0-9._%+-]+@[A-Za-z0-9.-]+\.[A-Za-z]{2,}"), "[EMAIL]"),
    (re.compile(r"\b[A-Z]{2}\d{2}(?: ?[A-Z0-9]{4}){3,7}(?: ?[A-Z0-9]{1,3})?\b"), "[IBAN]"),
    (re.compile(r"\b(?:\d[ -]?){13,19}\b"), "[CARD]"),
    (re.compile(r"\+\d[\d ()-]{7,}\d"), "[PHONE]"),
]


def redact(text: str) -> str:
    for pattern, label in REDACTIONS:
        text = pattern.sub(label, text)
    return text


def hash_user(user_id: str) -> str:
    """Keyed hash: stable for joining logs, useless to anyone without the key (unlike plain sha256)."""
    key = os.environ.get("LOG_HASH_KEY", "dev-only-key-change-me").encode()
    return hmac.new(key, user_id.encode(), hashlib.sha256).hexdigest()[:16]


# Tracing -----------------------------------------------------------------------------

@dataclass
class Span:
    trace_id: str
    span_id: str
    parent_id: str | None
    name: str
    start: float
    attrs: dict[str, Any] = field(default_factory=dict)


_current: contextvars.ContextVar[Span | None] = contextvars.ContextVar("current_span", default=None)


class Tracer:
    """Writes one JSON line per finished span. Child spans inherit the trace id of their parent."""

    def __init__(self, path: Path, clock: Callable[[], float], seed: int = 0) -> None:
        self.path, self.clock, self.rng = path, clock, random.Random(seed)
        path.parent.mkdir(parents=True, exist_ok=True)
        self.file = path.open("w", encoding="utf-8")

    def _id(self, bits: int) -> str:
        return f"{self.rng.getrandbits(bits):0{bits // 4}x}"

    @contextmanager
    def span(self, name: str, **attrs: Any):
        parent = _current.get()
        span = Span(parent.trace_id if parent else self._id(128), self._id(64),
                    parent.span_id if parent else None, name, self.clock(), dict(attrs))
        token = _current.set(span)
        status = "ok"
        try:
            yield span
        except Exception as exc:
            status = "error"
            span.attrs["error"] = type(exc).__name__
            raise
        finally:
            _current.reset(token)
            record = {"trace_id": span.trace_id, "span_id": span.span_id, "parent_id": span.parent_id,
                      "name": name, "start": round(span.start, 3),
                      "duration_ms": round((self.clock() - span.start) * 1000, 1), "status": status, **span.attrs}
            self.file.write(json.dumps(record) + "\n")

    def close(self) -> None:
        self.file.close()


# Simulated traffic ---------------------------------------------------------------------

def simulate(path: Path, days: int = 14, per_day: int = 150, seed: int = 7) -> None:
    rng = random.Random(seed)
    clock = FakeClock(START)
    day = {"n": 0}

    def groq_outcome() -> str:
        if day["n"] in (9, 10) and rng.random() < 0.35:
            return "429:20"                     # incident: long Retry-After, so the gateway falls back
        return "500" if rng.random() < 0.01 else "ok"

    groq = FakeProvider("groq", clock=clock, latency_fn=lambda: rng.lognormvariate(6.0, 0.35), outcome_fn=groq_outcome)
    gemini = FakeProvider("gemini", clock=clock, latency_fn=lambda: rng.lognormvariate(6.8, 0.30),
                          outcome_fn=lambda: "500" if rng.random() < 0.02 else "ok")
    routes = {name: [Route("groq", groq, "openai/gpt-oss-120b"), Route("gemini", gemini, "gemini-3.5-flash")]
              for name in ("triage", "draft")}
    gw = Gateway(routes, quota=Quota(usd_per_day=1.0, requests_per_minute=30), clock=clock, sleep=clock.sleep, seed=seed)
    tracer = Tracer(path, clock, seed)
    search, tickets = KBSearch(), load_tickets()

    for d in range(1, days + 1):
        day["n"] = d
        for i in range(per_day):
            clock.now = START + (d - 1) * 86_400 + i * (86_400 / per_day)
            t = rng.choice(tickets)
            user = f"cust-{rng.randint(1, 400)}"
            body = t.body + (" Reach me at dana.lee@example.com or +49 30 1234 5678." if rng.random() < 0.2 else "")
            body += f" (ref {d}-{i})"          # real tickets are unique, so the exact cache rarely hits
            try:
                with tracer.span("handle_ticket", user=hash_user(user), ticket=t.id, day=d) as root:
                    with tracer.span("triage") as s:
                        r = gw.chat(ticket_messages(t.subject, body), route="triage", user=user)
                        s.attrs.update(provider=r.provider, cache=r.cache, usd=r.cost_usd, attempts=len(r.attempts))
                    with tracer.span("kb_search") as s:
                        hits = search.search(t.text, k=3)
                        clock.now += 0.004
                        s.attrs["top"] = hits[0].article_id if hits else None
                    with tracer.span("draft") as s:
                        r = gw.chat(ticket_messages(t.subject, body), route="draft", user=user)
                        s.attrs.update(provider=r.provider, cache=r.cache, usd=r.cost_usd, attempts=len(r.attempts),
                                       excerpt=redact(body)[:80])
                    root.attrs["category"] = t.gold["category"]
            except Exception:  # noqa: BLE001  (the span already recorded the error)
                pass
    tracer.close()


# Dashboard -----------------------------------------------------------------------------

def percentile(values: list[float], q: float) -> float:
    ordered = sorted(values)
    return ordered[min(int(q * len(ordered)), len(ordered) - 1)]


def dashboard(path: Path) -> dict[int, dict[str, float]]:
    spans = [json.loads(line) for line in path.open(encoding="utf-8")]
    by_trace: dict[str, list[dict]] = defaultdict(list)
    for s in spans:
        by_trace[s["trace_id"]].append(s)
    rows: dict[int, dict[str, list]] = defaultdict(lambda: defaultdict(list))
    for trace in by_trace.values():
        root = next(s for s in trace if s["parent_id"] is None)
        row = rows[root["day"]]
        row["latency"].append(root["duration_ms"])
        row["error"].append(root["status"] != "ok")
        row["usd"].append(sum(s.get("usd", 0.0) for s in trace))
        draft = next((s for s in trace if s["name"] == "draft" and s["status"] == "ok"), None)
        row["fallback"].append(bool(draft) and draft["provider"] != "groq")
        row["retries"].append(sum(s.get("attempts", 1) - 1 for s in trace if "attempts" in s))
    summary = {}
    print(f"{'day':>3} {'tasks':>6} {'p50 ms':>7} {'p95 ms':>7} {'errors':>7} {'fallback':>9} {'retries':>8} {'USD per 1k tasks':>17}")
    for d in sorted(rows):
        r = rows[d]
        ok_usd = [u for u, e in zip(r["usd"], r["error"]) if not e]
        summary[d] = {"p50": statistics.median(r["latency"]), "p95": percentile(r["latency"], 0.95),
                      "error_rate": sum(r["error"]) / len(r["error"]), "fallback": sum(r["fallback"]) / len(r["fallback"]),
                      "retries": statistics.mean(r["retries"]), "usd_per_1k": 1000 * sum(ok_usd) / max(len(ok_usd), 1)}
        s = summary[d]
        print(f"{d:>3} {len(r['latency']):>6} {s['p50']:>7.0f} {s['p95']:>7.0f} {s['error_rate']:>7.1%} "
              f"{s['fallback']:>9.0%} {s['retries']:>8.2f} {s['usd_per_1k']:>17.3f}")
    return summary


def show_slowest_trace(path: Path, day: int) -> None:
    spans = [json.loads(line) for line in path.open(encoding="utf-8")]
    roots = [s for s in spans if s["parent_id"] is None and s["day"] == day]
    slow = max(roots, key=lambda s: s["duration_ms"])
    print(f"\nslowest trace on day {day}: {slow['trace_id'][:12]}... {slow['duration_ms']:.0f} ms, user {slow['user']}")
    for s in sorted((s for s in spans if s["trace_id"] == slow["trace_id"]), key=lambda s: (s["start"], s["parent_id"] is not None)):
        detail = {k: s[k] for k in ("provider", "attempts", "cache", "usd", "excerpt") if k in s}
        indent = "  " if s["parent_id"] is None else "    "
        print(f"{indent}{s['name']:<14}{s['duration_ms']:>8.0f} ms  {s['status']:<5} {detail}")


def chart(summary: dict[int, dict[str, float]], path: Path) -> None:
    """Two panels, one measure each (never two y-scales on one axis); the incident days are shaded."""
    import matplotlib
    matplotlib.use("Agg")
    import matplotlib.pyplot as plt

    ink, muted, surface = "#0b0b0b", "#52514e", "#fcfcfb"
    days = sorted(summary)
    fig, (a, b) = plt.subplots(1, 2, figsize=(10, 3.4), facecolor=surface)
    a.plot(days, [summary[d]["p50"] for d in days], color="#2a78d6", lw=2, marker="o", ms=5, label="p50")
    a.plot(days, [summary[d]["p95"] for d in days], color="#eb6834", lw=2, marker="o", ms=5, label="p95")
    a.set_title("Task latency (ms)", color=ink, loc="left")
    a.legend(frameon=False, labelcolor=muted, loc="upper left")
    b.bar(days, [summary[d]["usd_per_1k"] for d in days], color="#2a78d6", width=0.7)
    b.set_title("Cost per 1,000 tasks (USD)", color=ink, loc="left")
    for ax in (a, b):
        ax.set_facecolor(surface)
        ax.axvspan(8.5, 10.5, color="#f0efec", zorder=0)
        low, high = ax.get_ylim()
        ax.set_ylim(low, high + (high - low) * 0.12)                 # headroom so the label clears the data
        ax.text(9.5, high + (high - low) * 0.10, "incident", ha="center", va="top", color=muted, fontsize=8)
        ax.set_xlabel("day of September", color=muted)
        ax.tick_params(colors=muted)
        ax.grid(axis="y", color="#e5e4e0", lw=0.8)
        ax.set_axisbelow(True)
        for side in ("top", "right"):
            ax.spines[side].set_visible(False)
        for side in ("left", "bottom"):
            ax.spines[side].set_color("#c3c2b7")
    fig.tight_layout()
    fig.savefig(path, dpi=120, facecolor=surface)


if __name__ == "__main__":
    print(redact("Card 4111 1111 1111 1111, IBAN DE89 3704 0044 0532 0130 00, mail dana.lee@example.com, "
                 "call +49 30 1234 5678, invoice INV-2026-004512"))
    print("user cust-17 ->", hash_user("cust-17"))
    log = OUT / "m13_traces.jsonl"
    simulate(log)
    print(f"\nwrote {sum(1 for _ in log.open())} spans to {log.relative_to(Path.cwd())}\n")
    summary = dashboard(log)
    show_slowest_trace(log, 9)
    chart(summary, OUT / "m13_dashboard.png")
    print("\nchart saved to examples/out/m13_dashboard.png")
Code explained
- In simple words: a black-box flight recorder for the assistant that blanks out personal details, plus the instrument panel computed from what it recorded.
- What happens:
REDACTIONSandredact(text): regexes for emails, IBANs, card numbers (13 to 19 digits with optional separators), and international phone numbers, applied in that order. Invoice numbers such asINV-2026-004512are deliberately left alone: agents need them, and they are not personal data on their own.hash_user(user_id): HMAC-SHA256 with a key from theLOG_HASH_KEYenvironment variable (the fallback key is for local runs only), shortened to 16 hex characters.SpanandTracer: a minimal tracer. A trace is the record of one task end to end; a span is one step inside it, with a start time, a duration, a status, a parent, and attributes.Tracer.spanis a context manager: it creates a span, makes it the current span (acontextvarsvariable, so nested calls find their parent without passing it around), and writes one JSON line when the step finishes, marking iterrorif an exception escaped. This is the same model as OpenTelemetry, cut down to 40 lines.simulate: 14 days of traffic, 150 tickets a day, drawn from the real tickets, through the Part A gateway with fake providers. Latencies come from seeded log-normal distributions; on days 9 and 10 the primary provider answers 35 percent of calls with a 429 andRetry-After: 20, an incident planted on purpose. One ticket in five gets an email address and phone number appended, so redaction has something to do. Each ticket becomes a root spanhandle_ticketwith three children:triage,kb_search, anddraft.percentileanddashboard: group spans by trace, then by day, and compute p50 and p95 latency per task, error rate, fallback share, retries per task, and cost per 1,000 tasks, all from the JSONL file alone.show_slowest_trace: the drill-down: find the slowest task on a bad day and print its spans as a tree.chart: two panels (latency, cost), one measure each, with the incident days shaded. Matplotlib 3.11.2.
- Comes out:text
Card [CARD], IBAN [IBAN], mail [EMAIL], call [PHONE], invoice INV-2026-004512
user cust-17 -> 247cdda29fa7cd3b

wrote 8400 spans to examples/out/m13_traces.jsonl

day  tasks  p50 ms  p95 ms  errors  fallback  retries  USD per 1k tasks
  1    150     794    1256    0.0%        0%     0.03             0.040
  2    150     836    1359    0.0%        0%     0.03             0.040
  3    150     849    1236    0.0%        0%     0.02             0.040
  4    150     844    1229    0.0%        0%     0.01             0.040
  5    150     844    1202    0.0%        0%     0.01             0.040
  6    150     854    1375    0.0%        0%     0.03             0.040
  7    150     850    1300    0.0%        0%     0.01             0.040
  8    150     835    1304    0.0%        0%     0.01             0.040
  9    150    1533    2938    0.0%       41%     0.81             0.206
 10    150    1345    2799    0.0%       36%     0.65             0.177
 11    150     846    1264    0.0%        0%     0.02             0.040
 12    150     851    1339    0.0%        0%     0.03             0.040
 13    150     851    1618    0.0%        0%     0.05             0.039
 14    150     876    1351    0.0%        0%     0.03             0.040

slowest trace on day 9: dbba1e9341ad... 3625 ms, user db6882609bad0629
  handle_ticket     3625 ms  ok    {}
    triage            2302 ms  ok    {'provider': 'gemini', 'attempts': 3, 'cache': 'miss', 'usd': 0.000237}
    kb_search            4 ms  ok    {}
    draft             1320 ms  ok    {'provider': 'gemini', 'attempts': 2, 'cache': 'miss', 'usd': 0.000237, 'excerpt': 'Can I use the iPhone app on a plane without internet? Reach me at [EMAIL] or [PH'}

chart saved to examples/out/m13_dashboard.png
The first line is redaction working on a hostile sample. The replies in these traces are ScriptedLLM text, not model output, and the latencies are simulated; the logging, tracing, and dashboard code is real and would run unchanged on real spans.
Tracing multi-step and agentic flows
A single request log cannot explain the slowest ticket on day 9. The trace can: the task took 3.6 seconds, and 2.3 of those were triage, which needed 3 attempts before it landed on Gemini, then the draft needed 2 more. Nothing was broken in the code; the primary provider was rate-limiting, and the fallback did its job at the cost of latency. You find that in one read because every span carries its provider, attempts, cost, and a redacted excerpt, and because children point at their parent.
For agents (Module 8) the same structure scales: each model call, tool call, and approval wait is a span under the task's root, so a loop that ran 14 steps instead of 4 is visible as 14 children, each with its own cost. Three rules keep traces useful:
- One trace id per user-visible task, created at the entry point and passed (by context, as here, or in a header between services) to everything the task does.
- Record decisions, not only timings: which route, which provider, cache hit or miss, which prompt version, which flag variant. These are the attributes you will filter on during an incident.
- Redact at the span, before writing. Traces are copied to more places than logs are.
Quality, latency, and spend dashboards
Here is the chart the script saved, the kind of view the support lead should see every morning:
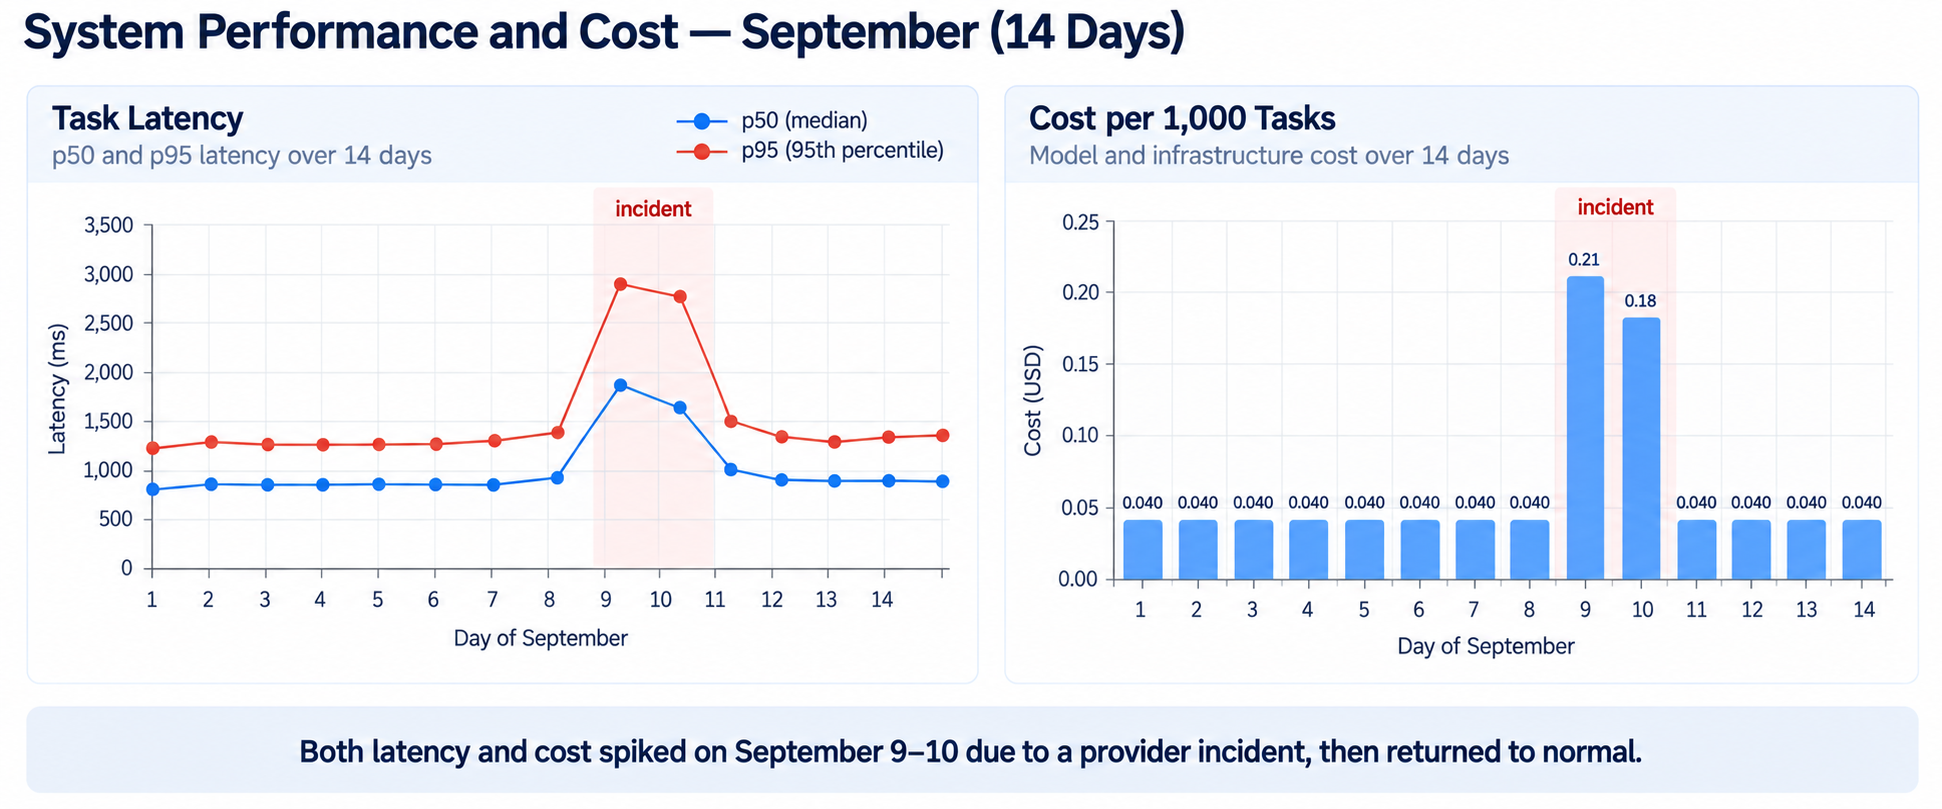
Read the table and chart together. On days 9 and 10, p95 latency more than doubled (1,300 to about 2,900 ms), 41 and 36 percent of tasks fell back to Gemini, retries per task rose from about 0.02 to 0.8, and cost per task rose five-fold (0.040 to 0.206 USD per 1,000 tasks) because the fallback model is more expensive. The error rate stayed at 0.0 percent. That last point is the lesson: a good fallback chain hides incidents from your error rate. If you only alert on errors, this incident is invisible. Alert on fallback share and cost per task as well.
What a dashboard for an LLM feature should show, and why:
| Panel | Metric | What it catches |
|---|---|---|
| Latency | p50 and p95 per task, and TTFT for streamed replies | Provider slowdowns, retry storms, longer outputs after a prompt change |
| Reliability | Error rate, fallback share, retries per task | Outages that fallback hides |
| Spend | Cost per task, cost per day, top users by cost | Price changes, routing drift, denial of wallet |
| Quality | Online signals from Module 10 (draft acceptance, edit distance, escalations) and a daily sample through the eval suite | Silent regressions no latency or error metric shows |
| Traffic | Volume and category mix | Drift in what users ask (next section) |
Use percentiles, not averages, for latency: an average hides the slow tail that users remember. And always divide cost by tasks, not by calls: a retry or fallback adds calls to the same task, and cost per call would hide it.
Drift detection and silent regression
Drift is a change in the distribution of what goes in (the ticket mix, languages, lengths) or what comes out (reply length, refusal rate, category predictions). Input drift can make a well-tested system meet traffic it was never tested on; output drift with unchanged inputs usually means the model or prompt changed, sometimes silently when a provider updates a model behind the same name. Neither shows up in a single trace.
Two standard measures compare this period with a baseline, bin by bin:
- Population Stability Index (PSI): the sum over bins of
(actual share - expected share) x ln(actual share / expected share). It measures how big the shift is. A common rule of thumb from credit scoring reads under 0.1 as stable, 0.1 to 0.25 as worth watching, and above 0.25 as a real shift. - Chi-square test: asks whether the two sets of counts could plausibly come from the same distribution, and returns a p-value. It measures how sure you can be that there is any shift at all.
The script samples weekly ticket mixes from the real category proportions of the 72 tickets, plants shifts of known size, and checks what each measure finds. Because we planted the shifts, we know the right answer.
examples/m13_drift.py
"""Drift detection: has this week's traffic (or this week's model output) moved away from the baseline?

Weekly ticket mixes are sampled from the real category proportions of the
72-ticket dataset (seeded), with a synthetic shift injected on purpose, so we
know the right answer and can check that the detectors find it.
"""
from __future__ import annotations

import math
import random
from collections import Counter

from scipy.stats import chi2_contingency

from supportdesk.data import CATEGORIES, load_tickets


def psi(expected: Counter, actual: Counter, keys, floor: float = 1e-4) -> float:
    """Population Stability Index: sum over bins of (a - e) * ln(a / e), using proportions."""
    e_total, a_total = sum(expected.values()), sum(actual.values())
    total = 0.0
    for k in keys:
        e = max(expected[k] / e_total, floor)
        a = max(actual[k] / a_total, floor)
        total += (a - e) * math.log(a / e)
    return total


def chi_square_p(expected: Counter, actual: Counter, keys) -> float:
    """p-value of a chi-square test that both weeks come from the same category distribution."""
    table = [[expected[k] for k in keys], [actual[k] for k in keys]]
    return chi2_contingency(table)[1]


def sample_week(weights: dict[str, float], n: int, rng: random.Random) -> Counter:
    return Counter(rng.choices(list(weights), weights=list(weights.values()), k=n))


def verdict(value: float) -> str:
    return "stable" if value < 0.1 else ("watch" if value < 0.25 else "ACT")


def main() -> None:
    base = Counter(t.gold["category"] for t in load_tickets())
    weights = {c: base[c] / sum(base.values()) for c in CATEGORIES}
    rng = random.Random(13)
    weeks = {"week 36 (baseline)": sample_week(weights, 1000, rng)}
    weeks["week 37 (no change)"] = sample_week(weights, 1000, rng)
    small = dict(weights, bug=weights["bug"] * 1.3)
    weeks["week 38 (bug +30%)"] = sample_week(small, 1000, rng)
    release = dict(weights, bug=weights["bug"] * 3, account_access=weights["account_access"] * 1.5)
    weeks["week 39 (bad release)"] = sample_week(release, 1000, rng)
    baseline = weeks["week 36 (baseline)"]

    print("share of tickets per category")
    print(f"{'week':<22}" + "".join(f"{c[:10]:>11}" for c in CATEGORIES))
    for name, counts in weeks.items():
        print(f"{name:<22}" + "".join(f"{counts[c] / sum(counts.values()):>11.1%}" for c in CATEGORIES))

    print(f"\n{'week vs baseline':<22}{'PSI':>7}{'verdict':>9}{'chi-square p':>14}")
    for name, counts in list(weeks.items())[1:]:
        value = psi(baseline, counts, CATEGORIES)
        print(f"{name:<22}{value:>7.3f}{verdict(value):>9}{chi_square_p(baseline, counts, CATEGORIES):>14.2g}")

    print("\nSame shift (bug +30%), different weekly volumes, 200 simulated weeks each:")
    for n in (100, 300, 1000, 3000):
        hits = Counter()
        for _ in range(200):
            a, b, same = sample_week(weights, n, rng), sample_week(small, n, rng), sample_week(weights, n, rng)
            hits["psi"] += psi(a, b, CATEGORIES) >= 0.1
            hits["psi_false"] += psi(a, same, CATEGORIES) >= 0.1
            hits["chi"] += chi_square_p(a, b, CATEGORIES) < 0.01
            hits["chi_false"] += chi_square_p(a, same, CATEGORIES) < 0.01
        print(f"  n={n:>5}/week: PSI>=0.1 flags {hits['psi'] / 2:>5.1f}% (false alarms {hits['psi_false'] / 2:>5.1f}%)"
              f"   chi-square p<0.01 flags {hits['chi'] / 2:>5.1f}% (false alarms {hits['chi_false'] / 2:.1f}%)")

    print("\nOutput drift: reply length in words, same inputs, model version changed silently")
    bins = ["<40", "40-79", "80-119", "120+"]

    def binned(lengths):
        return Counter(bins[min(int(x) // 40, 3)] for x in lengths)

    before = [rng.gauss(70, 18) for _ in range(800)]
    after = [rng.gauss(70 * 1.35, 25) for _ in range(800)]
    b, a = binned(before), binned(after)
    print("  bins:   " + "".join(f"{x:>8}" for x in bins))
    print("  before: " + "".join(f"{b[x]:>8}" for x in bins))
    print("  after:  " + "".join(f"{a[x]:>8}" for x in bins))
    value = psi(b, a, bins)
    print(f"  PSI {value:.3f} ({verdict(value)}), chi-square p {chi_square_p(b, a, bins):.2g}")


if __name__ == "__main__":
    main()
Code explained
- In simple words: compare this week's ticket mix with a normal week, with two different rulers, on data where we secretly know what changed.
- What happens:
psi(expected, actual, keys): the formula above, with a small floor so an empty bin does not produce a logarithm of zero.chi_square_p: SciPy'schi2_contingencyon a two-row table of counts (baseline week, this week).sample_week: draws n tickets from category weights with a seeded random generator.verdict: the PSI rule of thumb.main: four weeks (baseline, unchanged, bug tickets up 30 percent, and a bad release that triples bug tickets and adds half again to login problems); then 200 simulated weeks per volume to measure how often each measure flags the small shift and how often it raises a false alarm on an unchanged week; then output drift on reply lengths after a silent model change.
- Comes out:text
share of tickets per category
week                      billing cancellati account_ac        bug     how_to feature_re
week 36 (baseline)          23.4%       8.4%      24.0%      12.2%      25.2%       6.8%
week 37 (no change)         20.9%       7.8%      23.7%      13.1%      26.3%       8.2%
week 38 (bug +30%)          22.5%       7.0%      22.6%      16.3%      23.8%       7.8%
week 39 (bad release)       16.8%       6.4%      28.1%      25.8%      16.4%       6.5%

week vs baseline          PSI  verdict  chi-square p
week 37 (no change)     0.007   stable          0.62
week 38 (bug +30%)      0.018   stable          0.12
week 39 (bad release)   0.174    watch       1.2e-16

Same shift (bug +30%), different weekly volumes, 200 simulated weeks each:
  n=  100/week: PSI>=0.1 flags  44.0% (false alarms  41.5%)   chi-square p<0.01 flags   2.0% (false alarms 1.0%)
  n=  300/week: PSI>=0.1 flags   3.5% (false alarms   1.0%)   chi-square p<0.01 flags   2.0% (false alarms 0.5%)
  n= 1000/week: PSI>=0.1 flags   0.0% (false alarms   0.0%)   chi-square p<0.01 flags   9.5% (false alarms 0.0%)
  n= 3000/week: PSI>=0.1 flags   0.0% (false alarms   0.0%)   chi-square p<0.01 flags  62.0% (false alarms 0.5%)

Output drift: reply length in words, same inputs, model version changed silently
  bins:        <40   40-79  80-119    120+
  before:       27     550     220       3
  after:        15     195     458     132
  PSI 1.297 (ACT), chi-square p 6.4e-82
The two measures disagree in instructive ways. The bad release (bug share from 12 to 26 percent) gets a PSI of only 0.174, "watch", yet a chi-square p-value of 1e-16: the shift is certain and moderate in size. The 30 percent rise in bug tickets is real but small, and at 1,000 tickets a week neither measure catches it reliably.
The volume experiment shows why you need both. At 100 tickets a week, PSI flags 44 percent of weeks with the shift and 41.5 percent of weeks without it: at small volumes PSI mostly measures sampling noise, so a fixed 0.1 threshold is meaningless. Chi-square keeps its false alarms near the 1 percent it promises at every volume, and its power grows with volume (62 percent at 3,000 a week). A good alert combines them: the shift must be statistically real (chi-square p under 0.01) and large enough to matter (PSI above a threshold you calibrate on your own stable weeks).
Output drift is the silent-regression case. Same inputs, but replies got about 35 percent longer after an unannounced model change: PSI 1.3, p about 1e-82. No error rate, latency, or cost panel would flag this quickly (cost would creep up by the extra output tokens), and a longer draft is not necessarily a worse one. The alert's job is to make a person look, which is where the runbook comes in.
| Situation | Use this | Why |
|---|---|---|
| Is there any shift at all, at high volume? | Chi-square (or a two-sample test for numeric values) | Controls false alarms at every volume |
| Is the shift big enough to act on? | PSI, with a threshold calibrated on stable weeks | Measures size, not certainty |
| Low volume (under a few hundred per period) | Longer periods, or chi-square only | PSI is dominated by noise |
| Output behavior (length, refusals, categories, tool use) | Both, against a baseline taken from a known-good week | Catches silent model updates |
Incident response for model behavior changes
An LLM incident is often not an outage. It is "the drafts started quoting a 14-day refund window", "replies got long and chatty on Tuesday", or "the bill tripled overnight". The runbook below is what Brightlane's on-call engineer follows. Each step maps to a tool built in this module.
| Step | Action | Tool |
|---|---|---|
| 1. Detect | An alert fires on fallback share, cost per task, drift, or quality signals, or an agent reports a bad draft | Dashboard, drift check, Module 10 online signals |
| 2. Contain | If users could be harmed (wrong policy, leaked data, unsafe action), flip the kill switch for the route; tickets go to humans. Otherwise drain the bad provider or roll back the flag | Gateway.kill, disable_provider, Flag.set_percent(0, ...) |
| 3. Scope | Find the first bad trace; filter spans by route, provider, model, prompt version, and flag variant to see what changed and who was affected | JSONL traces, show_slowest_trace-style drill-downs |
| 4. Diagnose | Replay the affected inputs against the current and last-known-good configuration; run the regression suite | Part E's paired upgrade test |
| 5. Fix and verify | Pin the model version, revert the prompt, or correct the KB; rerun the suite; ramp back up behind a flag | Part E's flags |
| 6. Learn | Write a short blameless review: timeline, impact (tickets, cost), what detected it, and one new test or alert that would have caught it earlier | Add the failing cases to the golden set (Module 10) |
Two rules make the runbook work under pressure. Containment comes before diagnosis: flip the switch first, investigate with the pressure off. And every containment action must be reversible and logged, which is why the kill switch carries a reason string and the flag keeps its history.